SUMmOn shell
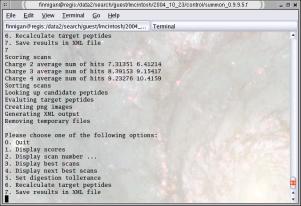
This is the main interface for SUMmOn.
Score distribution
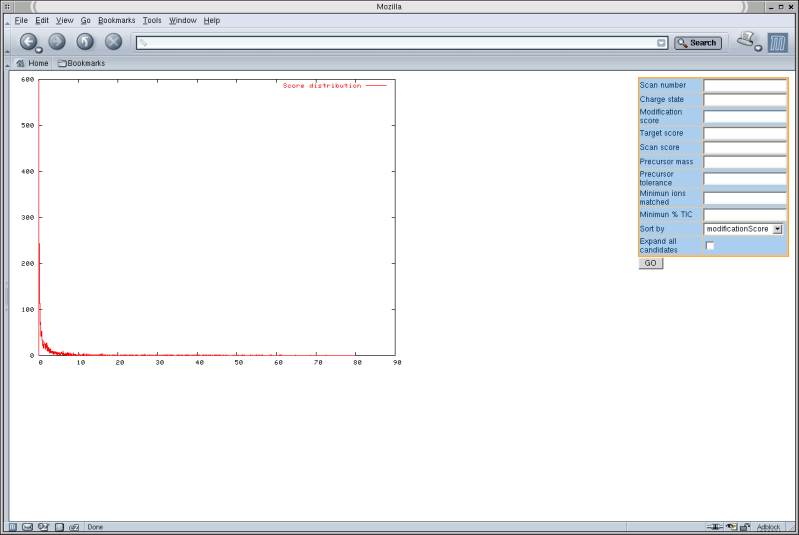
After the initial analysis is done and the results are saved into an XML document, they can be viewed in a standard Web-Browser. Here you see the score distribution for an MS run on SUMOylated RanGAP.
Scan view
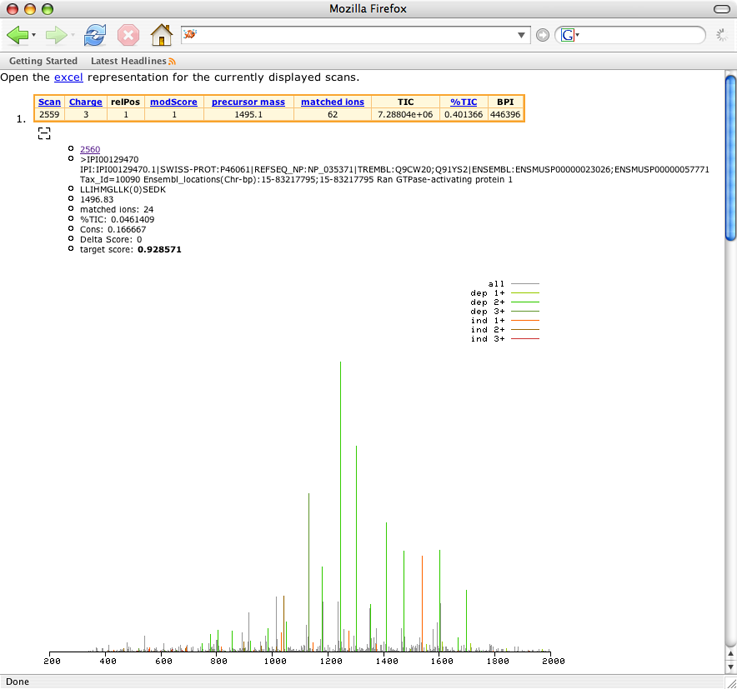
And this is how an identified spectra looks like.