SUMmOn Quickstart
Before starting this tutorial, your web-browser cache must be disabled.
To do this in:
- Firefox - enter about:config in the address field
- Type cache in the filter field
- Set browser.cache.disk.enable to false
- Set browser.cache.memory.enable to false
- Mozilla - select preferences from the edit menu
- Select cache from the Advanced tab
- Click on compare the page in the cache to the page on the network every time I view the page
- Internet Explorer - select internet options form the Tools menu
- Select the General tab
- Click on the Temporary internet files Settings button
- Select Check for newer versions of stored pages every visit to the page
Background
RanGAP1 is heavily SUMOylated in vivo and in vitro at K526. To test the ability of SUMmOn to identify a previously known SUMOylation site, a myc-tagged C-terminal RanGAP1 protein fragment (aa 420-589) was SUMOylated in vitro with either SUMO-1 or SUMO-2. The entire reaction mix (consisting of the human E1 proteins Aos1 and Uba2, the E2 protein Ubc9, creatine kinase, inorganic pyrophosphatase, SUMO, and the RanGAP1 fragment) was subjected to tryptic digestion, and peptides were analyzed using LC-ESI-MS/MS on an ion trap (ThermoFinnigan LCQ classic) instrument.
(At this point, it may be easier for you to print this tutorial.) Click on this link to start.
The SUMmOn user interface
In the browser window that just opened you will see the score distribution graph and the SUMmOn control center.

The graphs on the left side of the figure are the modification score distribution; the target peptide score distribution and the modification vs. targter peptide scores distribution for the RanGAP1_SUMO-1/C SUMmOn analysis. To generate the first two graph the scores have been binned (x axis) and the number of scans within each bin presented on the y axis.
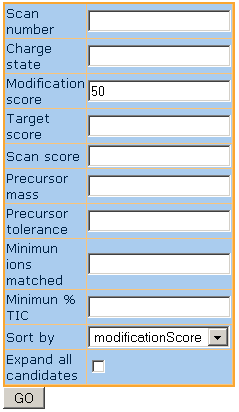
The SUMmOn control center is on the right side of the figure. You can use this form to filter, sort and select MS/MS scans from the current SUMmOn analysis.
In the SUMmOn control center enter a modification score of 0.9; a target score of 0.9 and press return (or click on the "GO" button). This will retrieve all spectra with a modification and a target score of 0.9 or above in the current run. Selecting a modification score threshold in the upper part of the score distribution is a good way to start the interpretation of a SUMmOn analysis.

In your browser you will now see the top scoring MS/MS spectra from this run.

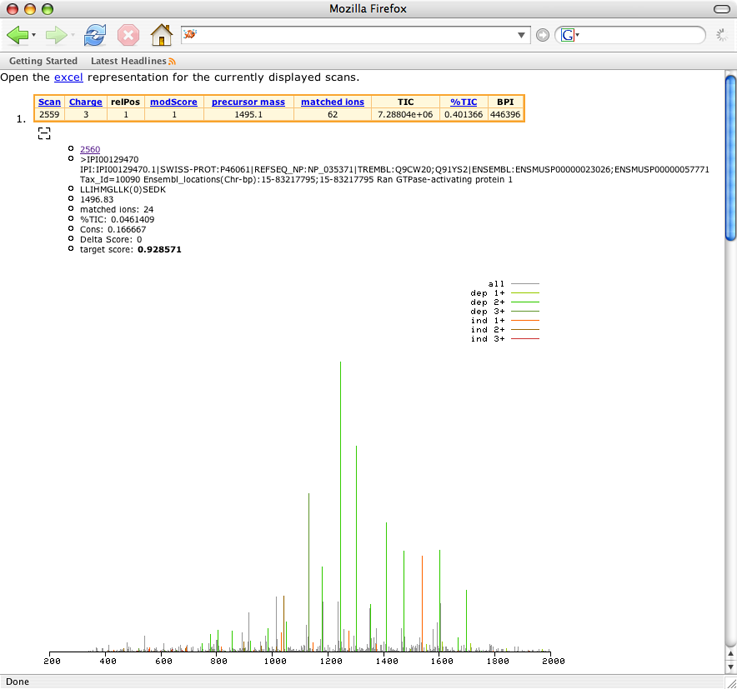
A yellow header table associated with each scan indicates the scan number, predicted charge state, modification score (modScore), calculated precursor mass (the calculated mass of the unmodified target peptide), the number of matched ions used to calculate the modification score, and several discussed below. Blue subheadings are hyperlinks.
Below the table is a typical graphical representation of a single MS/MS scan, displaying ion intensity (in raw ion counts) versus mass/charge (m/z) ratio. Ion peaks matching predicted SUMO-1 fragment ion m/z are indicated in various colors. Each SUMO ion series is assigned a different shade, as indicated in the upper right hand corner of the scan. Peaks not assigned to a SUMO fragment ion are displayed in grey. Ind/dep refer to whether or not the modification (for example, SUMO) ion series is dependent upon the target peptide: The SUMO b-ion series is independent of the target peptide, while the y-ion series is dependent. Dependent ion series are represented in shades of blue-green; independent ion series are represented in shades of brown-red. 1+, 2+, ... refer to the charge state of the particular ion series.
Lets take a closer look at the first scan, # 2875:
- It has a good modification score. Notice that the score for this scan is widely separated from the bulk of the modification scores.
- Most of the high intensity peaks in the scan have been matched to SUMO-1 ions. You can confirm this visuall,y or by checking the %TIC parameter in the header table. Also notice how multiple ions from each ion series were matched. Sometimes the most intense ions in a scan are matched, but only one or two ions from the various ion series are represented. The former is a much better indication of a potentially SUMOylated peptide.
- The scan has an impressive number of ions that matched to SUMO-1 fragment ions (matched ions). Notice that this number may be lower than the total number of ions matched, since it represents the total number of ions that were used in the calculation of the modification score.
- The relative position (relPos) of this charge state is 1. This run was acquired on an LCQ ion trap instrument. Due to the non-isotopic resolution of the instrument, for each scan SUMmOn assumed all possible charge states from +1 to +4. +4 yielded the highest modScore.
All of these factors tell us that this scan warrants further investigation.
Click on the [+] sign under the header table for scan 2875.

The sign will change to a [-], and you will now see the sequence of a putative target peptide, along with some other useful information regarding this hit. In this case, we know that the RanGAP1 SUMOylation site is contained in the peptide LLIHMGLLK(0)SEDK. The (0) indicates the position of the modified amino acid. This peptide has a theoretical mass of 1496.83. Compare this with the measured mass in the header table (1495.1). A close hit considering the resolution of an LCQ :) Other useful parameters are the target score and the number of target peptide ions matched.
We already know, from previously published data, that this is the correct SUMOylation site for RanGAP1, but what if we were looking at a previously uncharacterized protein? We would like to see some more evidence for this site before going back to the bench and starting the PCR machine.
Click on the precursor mass link in the header table.
This will display all scans in the current MS run with a precursor mass equal to 1495.1 ± 1. Notice that 1495.1 was automatically entered in the precursor mass field of the SUMmOn control center. The default precursor mass tolerance is 1 Da, but you can change this by entering a different number in the corresponding field of the SUMmOn control center. There now are 63 scans in your browser window.All scans have a relatively high modification score. This is an additionalconfirmation that this site is truly SUMOylated.
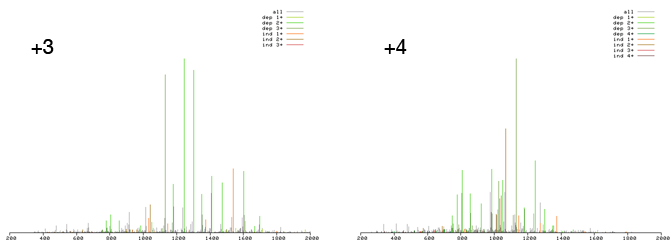
Scroll through the data paying attention to the scan representations. Do you see how there seem to be two distinct types of scans? One has a more central distribution of high intensity peaks while one has high intensity peaks shifted to the upper range of the m/z space? Now look at the charge states in the header table and you will discover that the former are generated by +4 precursor ions, while the latter have a +3 precursor ion. In the SUMmOn control center select "Sort by charge" and press the GO button. Quickly scroll through the data one more time, you will notice that the two scan types have separated into two distintict clusters. Scans from both charge states fit the profile of a good SUMO candidate described above. You can click on the [+] sign and confirm that SUMmOn assigned the same target peptide to the +3 scans. Seeing multiple charge states for the same target peptide further increases our confidence in the SUMOylation site prediction.

While it is reassuring to see multiple hits on the same SUMOylation site, keep in mind that different peptides can have the same mass. At some point in time you will see multiple scans with the same precursor mass which were not generated by the same peptide. After filtering your SUMmOn analysis for a given precursor mass it is thus good practice to make sure that your scans had similar retention times (asuming an LC-MS-MS/MS setup was used for the data acquisition).
In the SUMmOn control center select "Sort by scan number" and press the GO button.
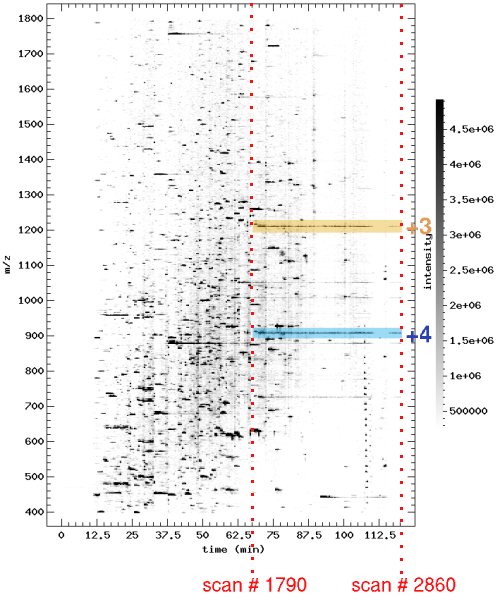
You will notice that the first scan is # 1791 and the last is # 2876. Normally, such a large spread should ring an alarm bell, but in this case there seems to be a continuum between the two scans, so that this may actually be a single, huge chromatographic peak eluting from the LC column. The easiest way to confirm this is to use a tool like Pep3D. For the purposes of this tutorial it is sufficient to know that Pep3D generates a 2 dimensional density plot of an LC-MS run. The x axis represents the retention time; the y axis represents the m/z values. More on Pep3D.

From this representation it is evident that we are dealing with a single chromatographic peak. Also notice the perfect overlap between the two charge states.
The remove m/z option. Close your window. Next, let's load the GST-SUMO1 multimerization data into your web browser. Select a modScore cutoff of 1, and hit Enter. Notably, none of the highest scoring scans in this run do not have target peptides assigned to them. Go to scan 1745 (entry 1), and click on the "Scan" hyperlink. You should now see three representations of the same scan, with SUMmOn assuming three different charge states, +5, +3 and +4. While the +5 charge state possesses a higher modScore, note that the +3 charge state predicts a precursor mass of only 19.9974 Da. This corresponds (approximately) to the size of an -OH group, and indicates the presence of unconjugated SUMO1 in the reaction mix. In other words, in these types of in vitro reactions free, unconjugated SUMO1 remains in the reaction mix and is assigned a high modScore by SUMmOn. If SUMmOn assigns the correct charge state for unconjugated SUMO, it will indicate a precursor mass of ~16 +/- 2, and if it assigns the wrong charge state to free SUMO1, it will suggest a precursor mass of approximately 736 Da for +4 or 1458 Da for +5. You can prevent scans with a specif m/z value +/- a given tolerance to be displayed using the "Remove m/z" and "Remove m/z tolerance" fields in the SUMmOn control center.
The detailled scan view and the ion table In the SUMmOn control center select a "Modification score" of a 0.9, a "Target score" of 0.9 and hit enter. Expand the target peptide information for scan 1340 (entry number 1) by clicking on the [+] sign. Now open thhe hyperlink pointed to by 1341 in a new window (or even better, if you are using firefox/mozilla in a new tab).This will open a page with showing scan 1340 with the ions from target peptide 1341 that matched highlited in various colours. Under the scan you will also see an "ion table" summarizing all the matched ions for this target peptide. When this page as finished loading (it is very important to wait before performing the next click in order to obtain meaningfull results!) go back to the original page and click on the hyperlink represented by the scan picture for scan 1340 (open this in a new window/tab as well). This will open a similar page to the one that was opened by clicking on the target peptide, but now the highlighted peaks and the ion table will correspond to the modification ions. Put the two new windows side by side, or quickly switch between the two new tabs, and notice how some of the high intensity ions that are not matched by the modification are matched by the target peptide. This provide a further confirmation that the assignemnt made by SUMmOn might indeed be correct. Now have a look the ion tables for the modification and the taget peptide and look for continuity in the matching of ion series. Take mental note of this picture and close the the two new windows/tabs. Also keep in mind that in our experience the modification tends to give a much better fragmentation in MS/MS when compared to the target peptide (in other words the ions matched by the target peptide have a tendency of being less intense and more sparse than the ones matched by the modification). Scroll down to scan 492 (entry number 3). Repeat the same operations you did for scan 1340. Do you see how much less consistent the continuity in the ion matching is for this scna? This should make you suspicious about the correctness of the assignement on scan 492.
The Excel link. From the SUMmOn Scan view, you can instantly generate an Excel spreadsheet containing information on all of the current MS/MS scans loaded into the browser. This is particularly usefull when you have many scans that passed your filtering criteria and you want to get a quick overlook. With the GST-SUMO1 multimerization file loaded into your browser, set a cutoff of "Modification score" at 0.6 and one on the "Target score" of 0.9 (hint: after an initial look at your data using stringent cutoffs on both the modification and the target scores try to relax one of the two cutoffs at a time). Hit the excel link at the top of the page. You will be asked whether to save this file to disk or view it now in Microsoft Excel. Choose the "open with" option. Your computer should start Excel, and you should see a spreadsheet containing information from all of the MS/MS scans currently loaded into your browser. Displayed are file location, scan number, charge state, modScore, precursor mass, protein ID, peptide sequence, and target score. Importantly, this view groups all scans from the same peptides and proteins together. Using these cutoff values two SUMO1 peptides yield multiple hits: GSMSDQEAKPSTEDLGDK (1895 Da; also present with an ozidized Methionine, 2039 Da), and GSMSDQEAKPSTEDLGDKK (2023 Da). Note that the presence of peptide in its oxidized and unoxidized forms (both of which recieved high scores by SUMmOn) further adds to the confidence of the modification site assignement. The Excel spreadsheet thus provides you with a second, complementary way to view your data.
Validation, validation, validation! Congratulation you have just made it to the end of this tutorial! Hopefully, you now have a better feeling for what constitutes a correct/incorrect SUMmOn assignment, but even more importantly you will know by now that it is very important to carefully validate the results returned by the program before going back to the bench.